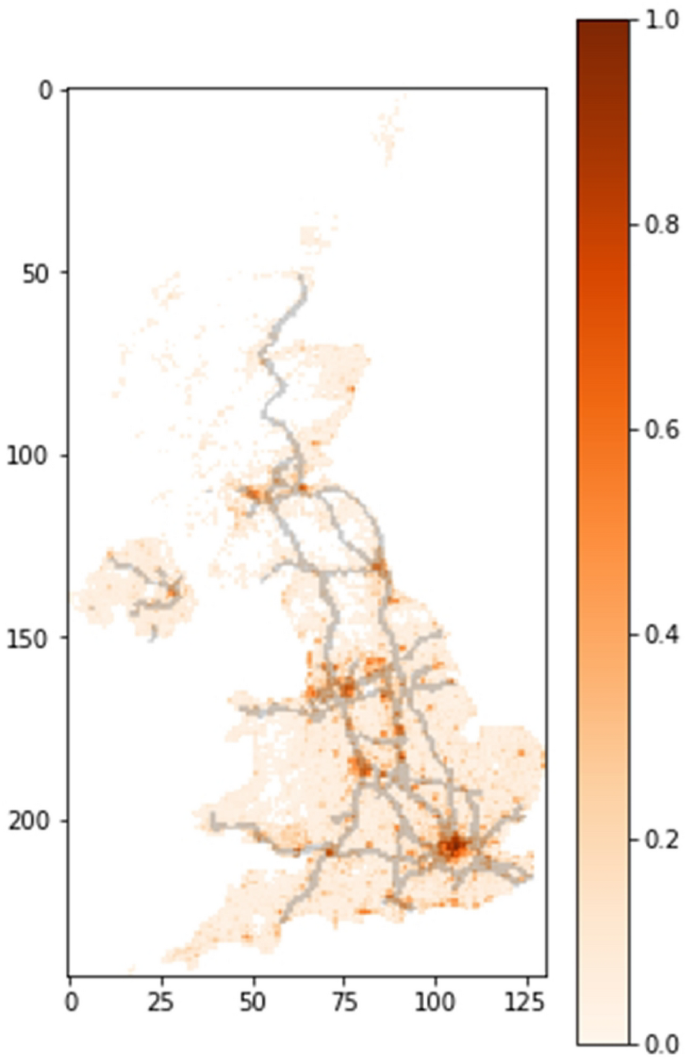
The model was applied to the case of the United Kingdom (UK). As stated above, to apply the model to a specific country, data about its population density are required. The information to generate the density map was extracted from the “Global High Resolution Population Denominators Project”20. The main routes were obtained from Google Maps. In order to compute the geo-stochastic spreading of the virus, the map was divided into a grid of squares, with an area of 25 km(^2) (see Fig. 2).

UK normalized population density and main routes map. The map is divided in a grid of squares of 25 km(^2). The map was generated using custom code21.
The dynamics of different strains of the virus is very well documented in the UK, consequently the available information suffices to fit the parameters of the model for the different variants. For simplicity, only the most abundant strains over time were considered in the adjustment. These are: the EU1 strain (B. 1.177 originated in Europe), the Alpha (B.1.1.7) and the Delta (B.1.617.2). The rest of the variants, less abundant and of less interest, are grouped together under the name “other strains”. Information about the variants was obtained from CoVariants22 enabled by data from GISAID23. We used the same values of the time delay parameters (sigma _k), (omega _k) and (z_k) for all the variants, since, despite this simplification, the model produces very good results. The upper panel of Table 1 shows the values of the parameters used in the calculations.
The vaccination rate (v_r) was fitted over time in order to adjust the model to the real immunization data (delayed 14 days to ensure immunity development). Data on vaccination and daily cases were obtained from “Our World in Data”2,24 and Johns Hopkins University1. 66% of the population was fully vaccinated by the end of September. Taking into account the willingness to be vaccinated2,24 in the United Kingdom, however, it is not expected that a large population group will be vaccinated after that. For simplicity, in the model we consider that 70% of the population will be immunized.
We used the stringency index25 (a measure of the severity of government policies during the pandemic) as a guide to fit mobility (nu) over time. In order to reduce the amount of fitting parameters we employed the same value of (nu) for both neighbor and far mobility (the latter was weighted by the origin and destination densities). Mobility was adjusted up to August 15, 2021, leaving the same value from then on. Any change in government policies, increasing or decreasing restrictions, could produce a modification of the results. kT was left on a low level (0.1) since, from the beginning of the pandemic, there have been multiple measures to reduce mobility (internal restrictions and bans or quarantine for travellers entering the UK from high-risk regions)2,25. The parameter (beta _k), which reflects how contagious a strain is, was changed to fit the actual curves for each variant. As we mentioned before, new variants could be more contagious5,6 and suppress previous ones. In this sense, (beta _k) determines how variants will compete and eventually become the dominant strain over time. The lower panel on Table 1 shows the fitted (beta _k) values for each strain. At the same time, some vaccines have exhibited a lower effectiveness against some variants26. To take this into account we used the (gamma _k) parameter. Given a kth strain, the higher (gamma _k), the more likely that a vaccinated person will get infected by it. Some parameters such as the period of immunity conferred by the vaccine and the efficiency for some variants still need further study. We emphasize here that the immunity period that the vaccines provide, together with the inherent efficiency of the vaccines are the important factors to be considered. Therefore, we decided to propose three possible different scenarios:
-
Short vaccine immunity period ((delta = 180) days) and relatively high vaccine efficiency against delta variant ((gamma _{delta} = 0.1))
-
Long vaccine immunity period ((delta = 360) days) and low vaccine efficiency against delta variant ((gamma _{delta} = 0.3))
-
Long vaccine immunity period ((delta = 360) days) and relatively high vaccine efficiency against delta variant ((gamma _{delta} = 0.1))
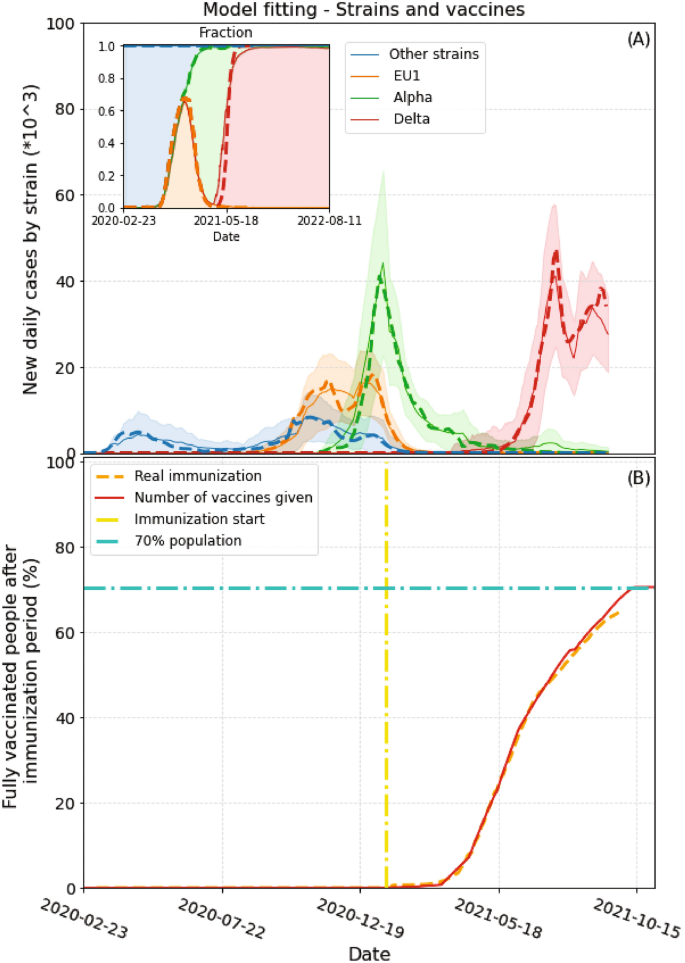
When computing the dynamics of the model, we adjusted (beta _k) and (v_r) to fit the new cases of each variant and the real vaccination rate, respectively. Figure 3A shows the fitting for each variant until September 10. Adjusted values of (beta _k) are shown in Table 1. The inset in the figure shows the fraction of infections with each variant. In order to fit the fast case growth of the delta variant (which cannot be explained only in terms of mobility changes) we had to use a very high (beta _{delta}) value and a lower value of (epsilon _{delta}) (0) (see Table 1). In order to emphasize the evolution of the Delta variant, in the inset we show a longer period of time. From Fig. 3A it is clear that at the current transmission rate this strain will become dominant and, unless a new, more contagious, variant appears, it will prevail in the near future. Figure 3B shows immunization as a function of time. In this case the vaccination rate was changed on the model to fit the actual data with a delay of 14 days. This delay was added to ensure that fully vaccinated people reach actual immunization. The dashed orange curve represent official data while the red solid line corresponds to the model immunization progress. As mentioned before, vaccination stops when 70% population is reached

Model fitting to strain and vaccination data. (A) Daily cases differentiated by strain. Dashed lines represent actual cases of each strain (scaled). Solid lines and shaded areas represent the average and standard deviations obtained from 100 runs of the model, respectively. The inset shows the fraction of cases for each variant for a longer period of time. The Delta variant is expected to prevail if no new more contagious variants appear. (B) Immunization over time. Yellow dash-dot line signals the day immunization started. Red solid line represents the percentage of fully immunized people in the model in time. The dashed orange line depicts the actual two-dose vaccination data (with 14 days delay, which is the average time needed to acquire full immunity after the second dose).
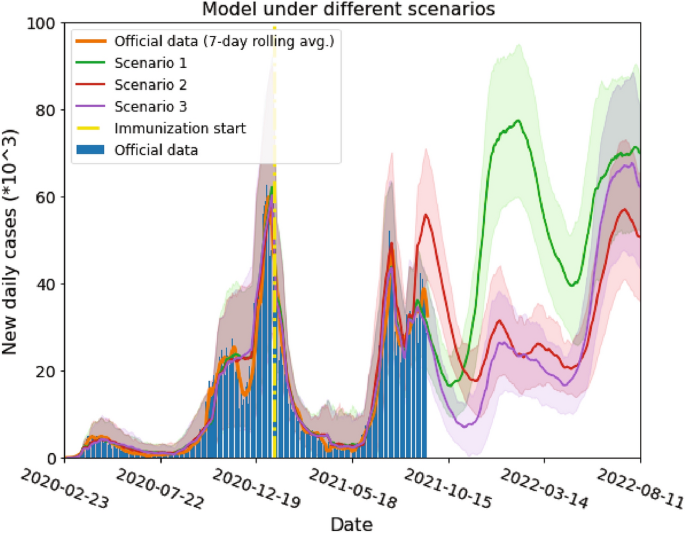
Figure 4 shows the three scenarios mentioned above. The orange solid line represents a 7-day moving average of the new daily cases which are depicted by the blue bars. The start of the vaccination in the model is indicated with a yellow dash-dot line. The model evolution under the first scenario is represented by the green solid line. With a high efficiency vaccine, a low amount of breakthrough infections (infected while fully vaccinated) is expected in the short term, at the current mobility rate. On the other hand, a short immunity period (only 180 days) leads to a massive COVID-19 outbreak for the beginning of 2022, if no restriction measures are imposed in the future.

Model results for three different scenarios. Red, green and violet solid lines are the model simulation results under scenarios 1, 2 and 3 (see text), respectively. Shaded areas on each color represent the standard deviation from 100 model runs for each scenario. Yellow dash-dot vertical line indicates the day when immunization started. Blue bars and solid orange lines are the actual daily cases and their 7 day rolling average, respectively. In scenario 1, a short vaccination immunity period implies a growth of the daily cases in the near future, if current mobility is sustained. Under scenario 2, people are expected to be immune for a longer time and breakthrough infections will act as antibodies boosters, prolonging the defence against the pandemic. In scenario 3 most people will be immune in the near future, lowering the number of cases, and a new wave would appear when vaccine immunity ends.
The model applied to the second scenario is shown in red. As we mentioned before, the model was conceived with the assumption that if a person presents a breakthrough infection, his/her immune system is boosted and therefore he/she will remain immune (delta) additional days after infection. This assumption is sensible, given the abundant evidence of increased antibody levels when a previously infected person is vaccinated27,28,29. This is clearly shown by the model dynamics in Fig. 4. In this scenario, while a quite large number of people have a breakthrough infection (given a relatively low effectiveness of the vaccine against delta variant) their immune system is boosted and they stay immune for a longer period of time. Therefore, we expect a larger amount of cases in the short term, while in the long term, more people will remain immune, consistently reducing the number of cases over time. In this scenario, if the majority of the population loses their immunity, a new wave is expected in July 2022. This suggests the need of new vaccines, effective against new variants, in the years to come. Additionally, breakthrough infections could help reducing the number of cases in the long term while not increasing the amount of deaths.
The third scenario is depicted by the violet solid line in the figure. A smaller amount of cases is expected in the near future since most people are fully immunized. Afterwards, however, we expect a new growth of daily cases by the spring 2022. This growth is due to the loss of most people’s immunity. It is interesting to notice that, under our assumptions, the last peak in the 3rd scenario is predicted to be higher than in the 2nd one. This occurs because a lower efficacy of the vaccine implies a greater number of infections and, thus, re-immunized people. This antibody boost reduces the number of susceptible people by July 2022 lowering the height of the cases peak.
More data are still needed in order to decide which scenario is closer to the real one. However, our predictions raise questions about the proper management of the pandemic. How should vaccines be administered? Are non-pharmaceutical interventions a long-term solution? Is the pandemic here to stay? Our results suggest that new COVID-19 waves will come if highly transmissible, vaccine-resistant variants, are present. This would imply the need of new shots including strain-specific proteins. However, mass vaccination is clearly the key to reduce the appearance of new variants of concern and, consequently, the need of those specific shots. There is currently a huge debate in the world on this matter30,31,32. If vaccinated people get a mild version of the infection, COVID-19 will turn out to be a common, relatively harmless, influenza-like disease and (as shown in our model) there will be less susceptible people over time. Under these assumptions, mobility restrictions should be applied mainly to contain the spread of new variants of concern and boosters should only be given to high risk groups in the near future. Long-term booster vaccination is a different discussion to be considered, as there is no information on the duration of its immunity yet. The results of the present study seem to imply that the world’s population would probably need to be vaccinated periodically in the years to come. (See the Supplementary Materials for additional results.
In a changing scenario, during the publication process of this manuscript, the Omicron variant emerged, having a higher transmission coefficient, and becoming the prevalent variant worldwide. Updated results including this strain can be found in the Supplementary Materials.
Discussion
Given the global impact of the COVID-19 pandemic, reliable models to analyze the virus propagation, including the variants of concern, are crucial to explore effective mitigation strategies. Our geo-stochastic multi-variant SEIRS-V model provides means of accurately describing the dynamics of the pandemic, as shown here. The model clearly separates the biological and social parameters. This property enables it to explain some global features observed in the daily number of worldwide cases. For instance, the surge of periodical waves is not strictly related to the appearance of new variants.These unexpected periods, have been seen in various countries with varying vaccination and social-distancing schemes. Our model can explain this global pattern, as naturally related to the biological parameters it includes, such as the immunity time of the recovered patients and the immunity time conferred by vaccines.
In the present work, we applied the model to the UK, and found that it successfully describes the dynamics of the pandemic. Notice that it was essential to fit variant-dependant epidemiological parameters like the transmission coefficients ((beta _{k})) for the Alpha and Delta variants of the disease. We identified the epidemiological parameters which determine the dominant variant: the one possessing larger transmission coefficient ((beta)) or smaller exposed period ((epsilon)) will eventually become dominant. Interestingly, as new variants with higher transmission coefficient appear, they quickly become the prevalent strain.
We emphasise that the model is applicable to any country with reliable data, as previously shown for Finland, Iceland, Mexico, Spain and Argentina17,18,19. Here we included the main variants of concern for the UK. The social parameters included in the model, as the different mobility types, allow to distinguish the effects of behavioural and cultural differences. Notice that in our model the biological parameters describe the properties of the disease, thus the same parameters could be used for any country, as in particular for Spain and Argentina is the case (see Supplementary Materials).
Furthermore, this model is useful to predict future scenarios, testing pharmaceutical and non-pharmaceutical interventions, and in particular to optimize the timing of vaccination boosters in order to minimize the appearance of new waves of the disease.
Modelling the interplay of SARS-CoV-2 variants in the United Kingdom & More Latest News Update
Modelling the interplay of SARS-CoV-2 variants in the United Kingdom & More Live News
All this news that I have made and shared for you people, you will like it very much and in it we keep bringing topics for you people like every time so that you keep getting news information like trending topics and you It is our goal to be able to get
all kinds of news without going through us so that we can reach you the latest and best news for free so that you can move ahead further by getting the information of that news together with you. Later on, we will continue
to give information about more today world news update types of latest news through posts on our website so that you always keep moving forward in that news and whatever kind of information will be there, it will definitely be conveyed to you people.
Modelling the interplay of SARS-CoV-2 variants in the United Kingdom & More News Today
All this news that I have brought up to you or will be the most different and best news that you people are not going to get anywhere, along with the information Trending News, Breaking News, Health News, Science News, Sports News, Entertainment News, Technology News, Business News, World News of this news, you can get other types of news along with your country and city. You will be able to get information related to, as well as you will be able to get information about what is going on around you through us for free
so that you can make yourself a knowledgeable by getting complete information about your country and state and information about news. Whatever is being given through us, I have tried to bring it to you through other websites, which you may like
very much and if you like all this news, then definitely around you. Along with the people of India, keep sharing such news necessary to your loved ones, let all the news influence them and they can move forward two steps further.
Credit Goes To News Website – This Original Content Owner News Website . This Is Not My Content So If You Want To Read Original Content You Can Follow Below Links
